📄 Full GUI findings report (PDF)
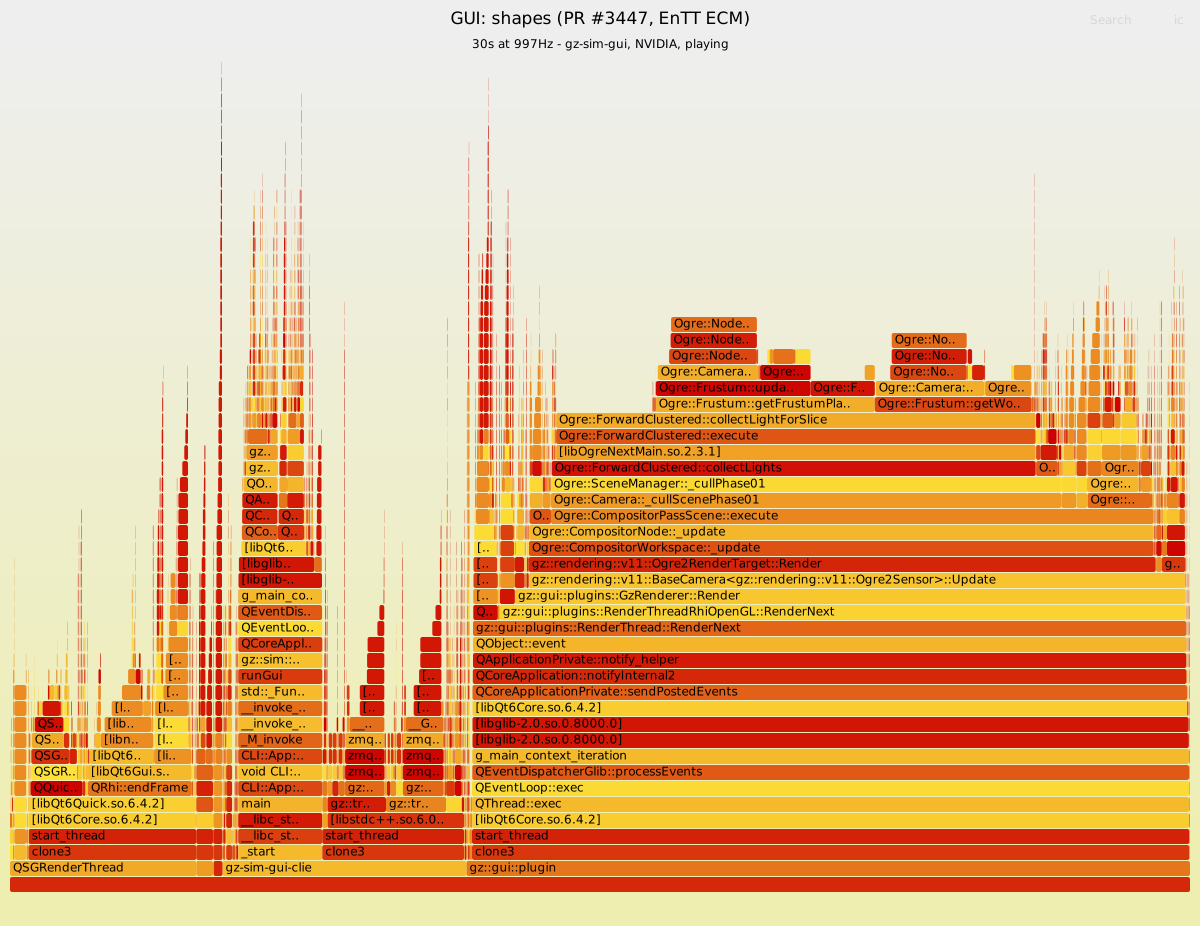
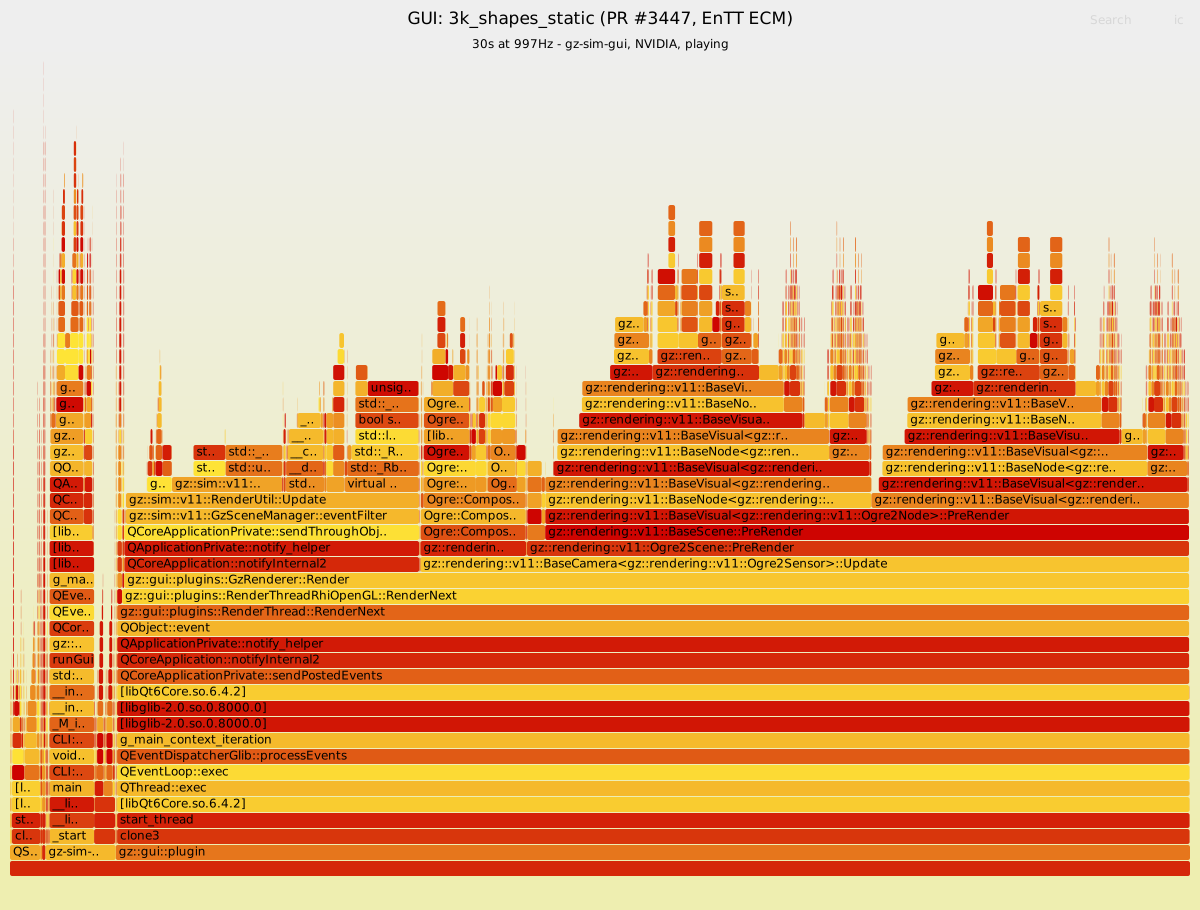
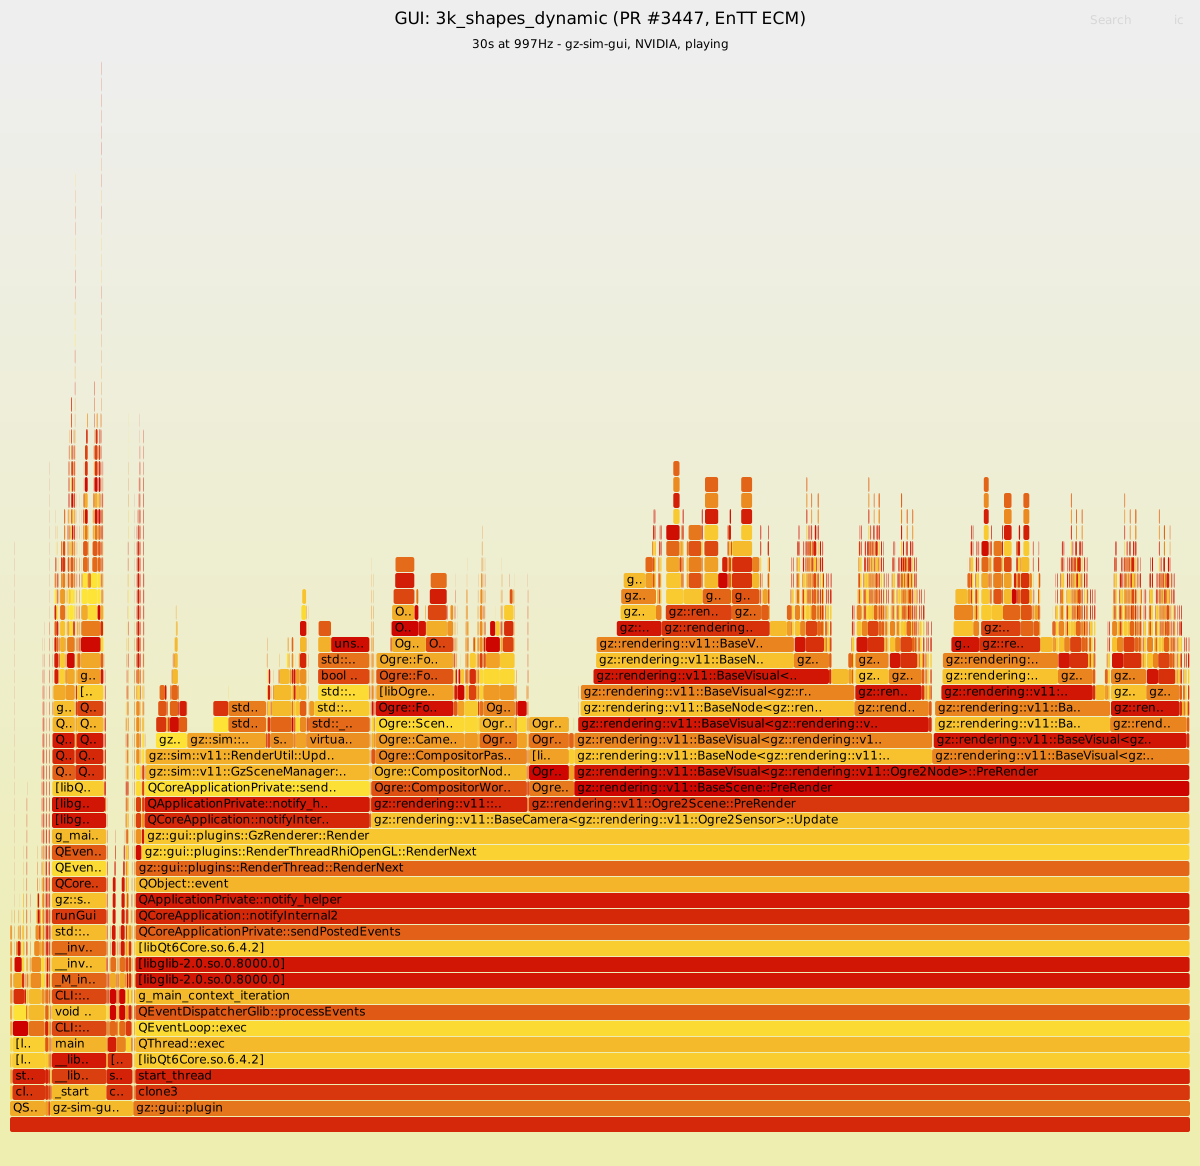
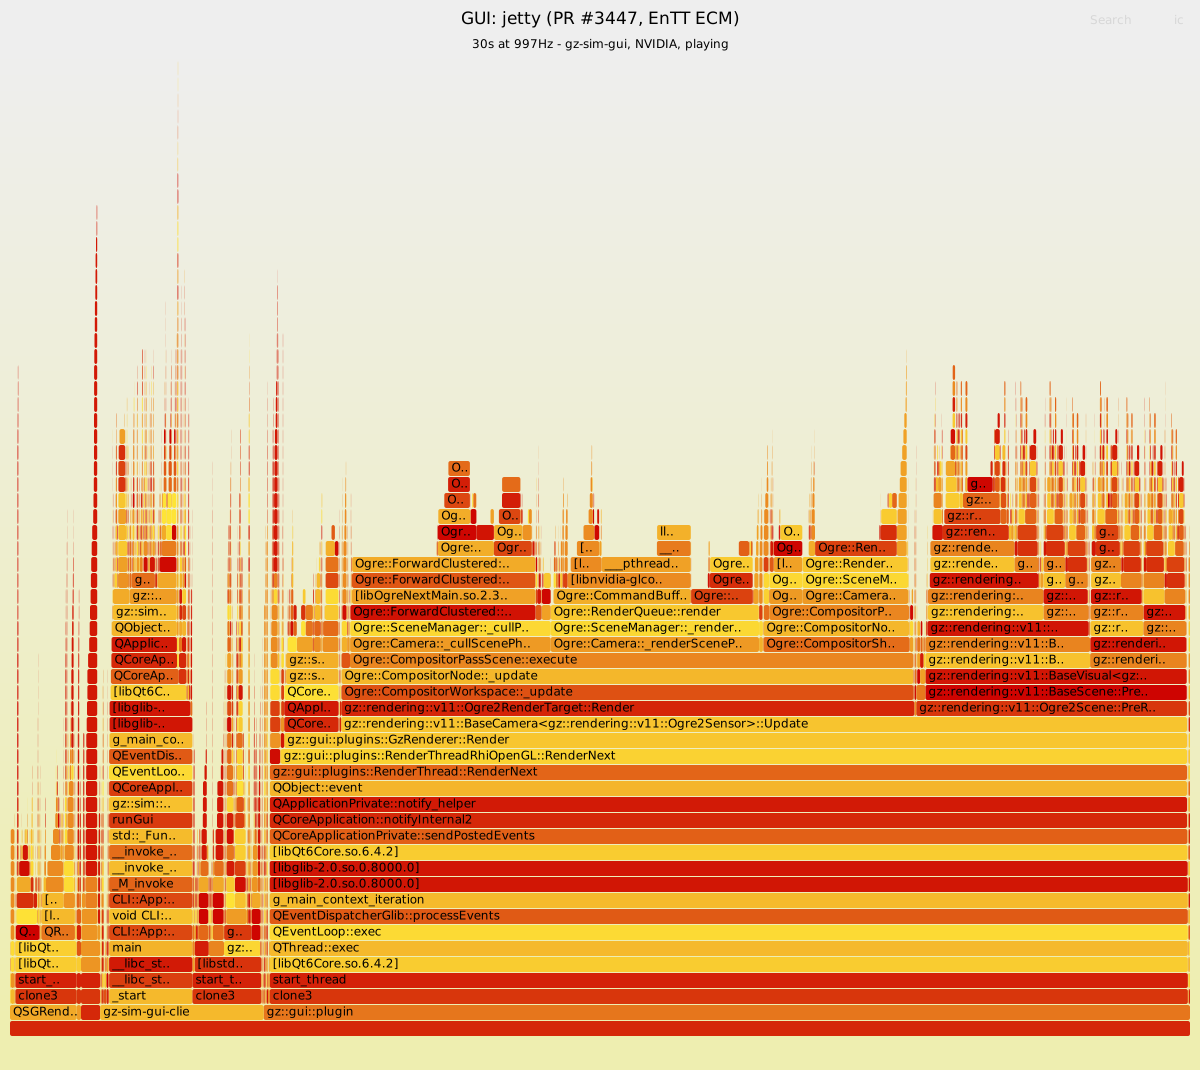
Profiling of the Gazebo GUI process (gz-sim-gui-client),
on the PR #3447 (EnTT ECM) baseline.
CPU: Intel Core Ultra 9 285HX (hybrid) · GPU: NVIDIA RTX PRO 3000 (PRIME offload)
· Kernel 6.17.0-35 · perf 6.17.13
Sampled with perf -e task-clock -F 997 --call-graph dwarf, server playing
(gz sim -r), all worlds at RTF=0.
Click any flamegraph to open it interactively (click frames to zoom, Ctrl+F to search).
| World | Avg cores busy | Render thread | Flamegraph |
|---|---|---|---|
| shapes (idle baseline) | 0.16 | 61% | Open |
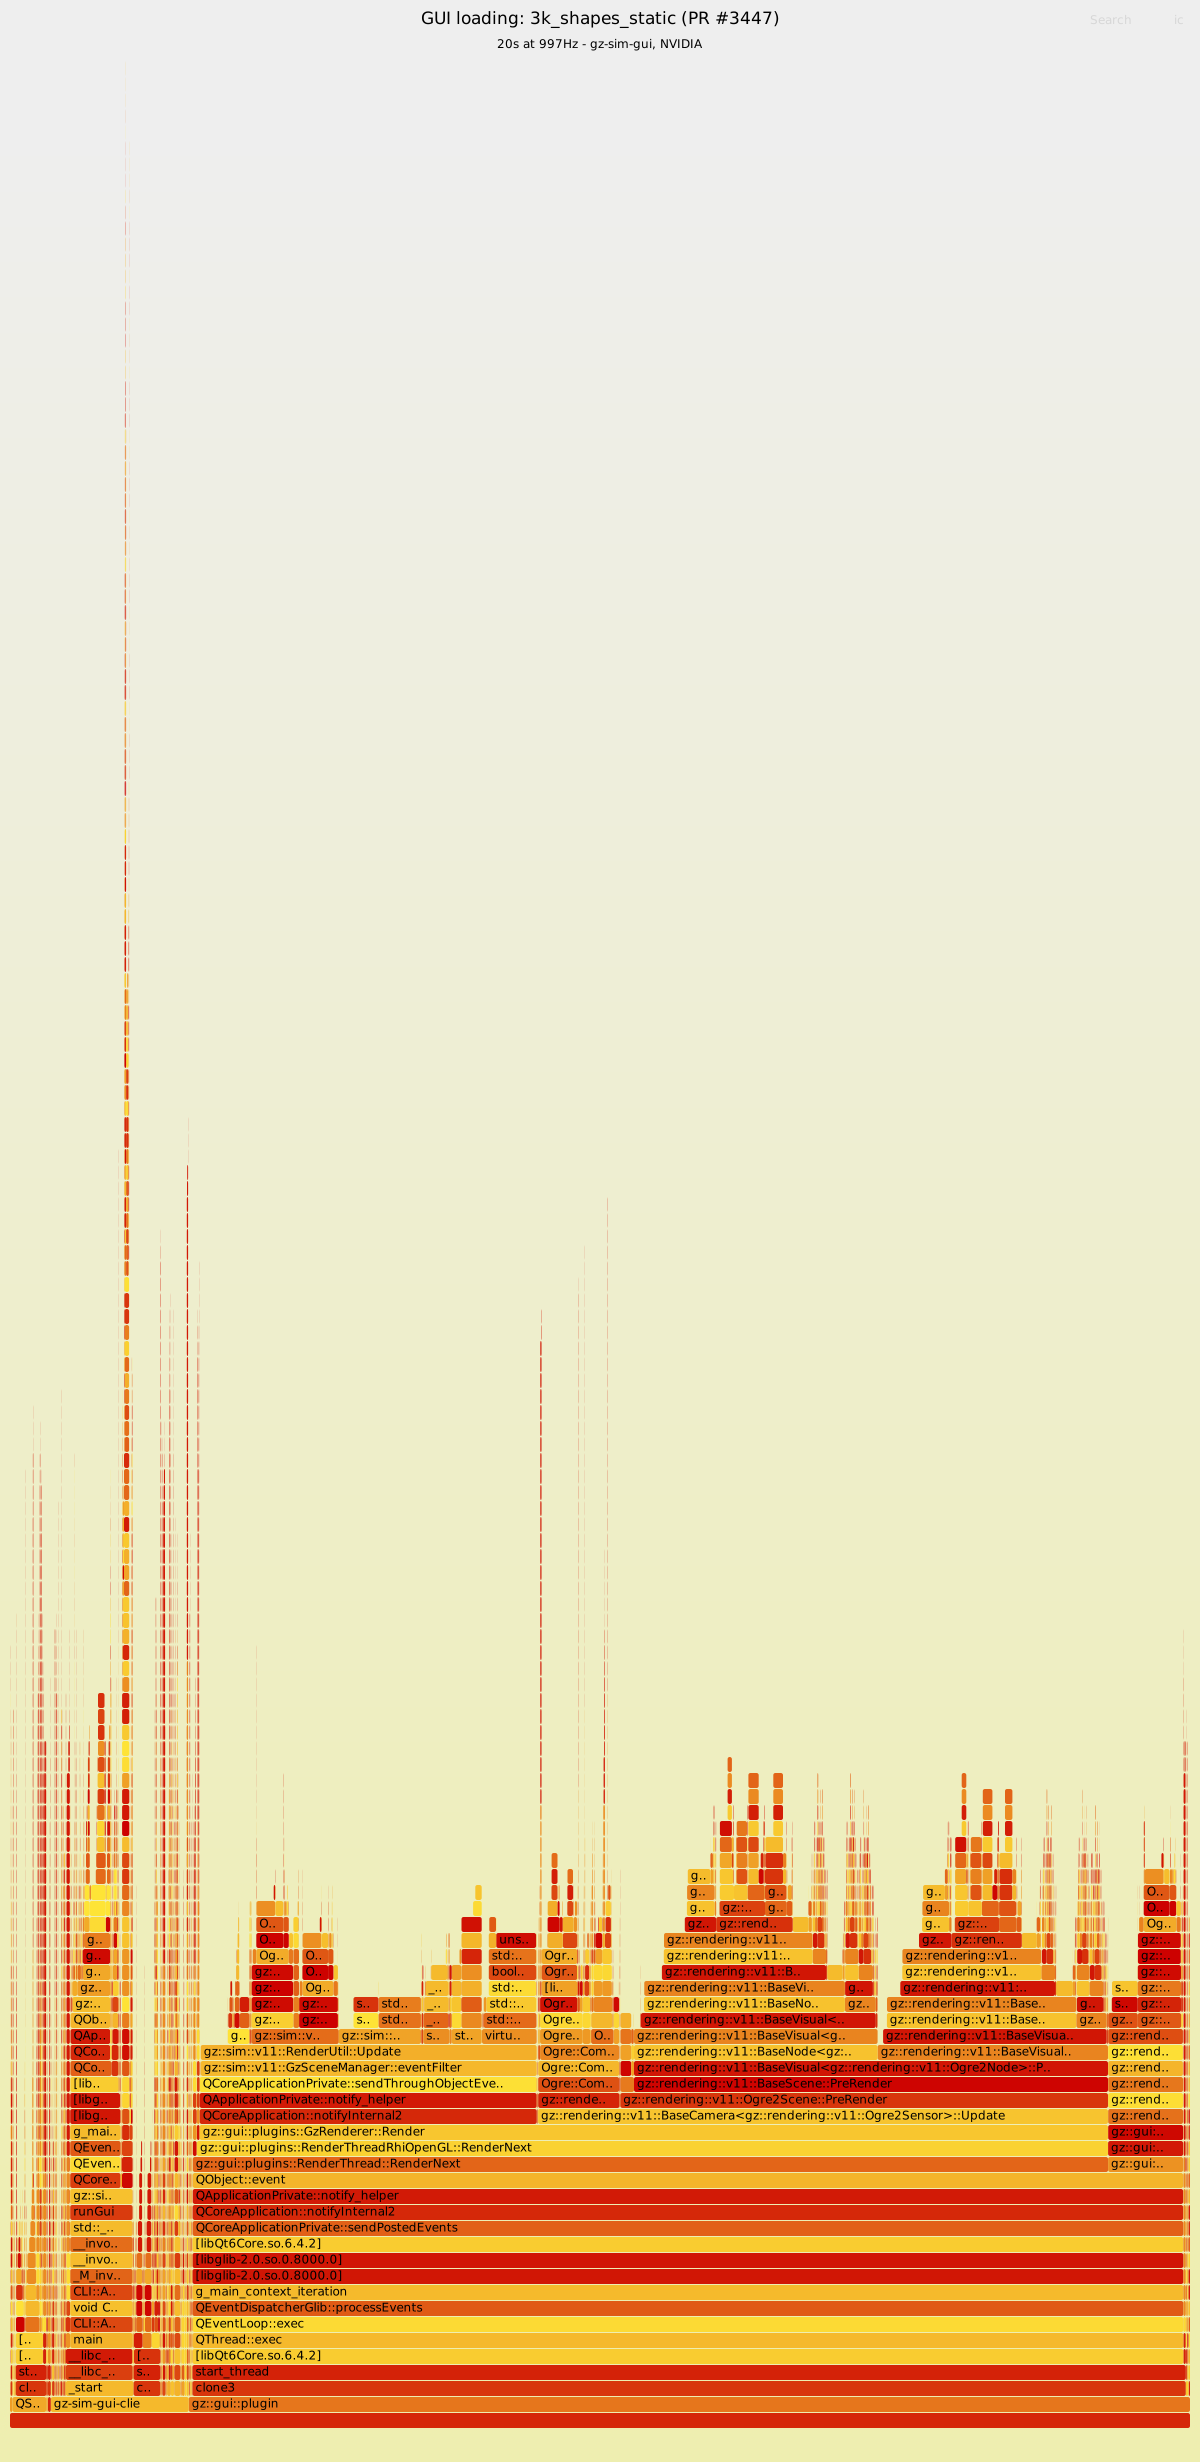
| 3k_shapes_static | 1.05 | 91% | Open |
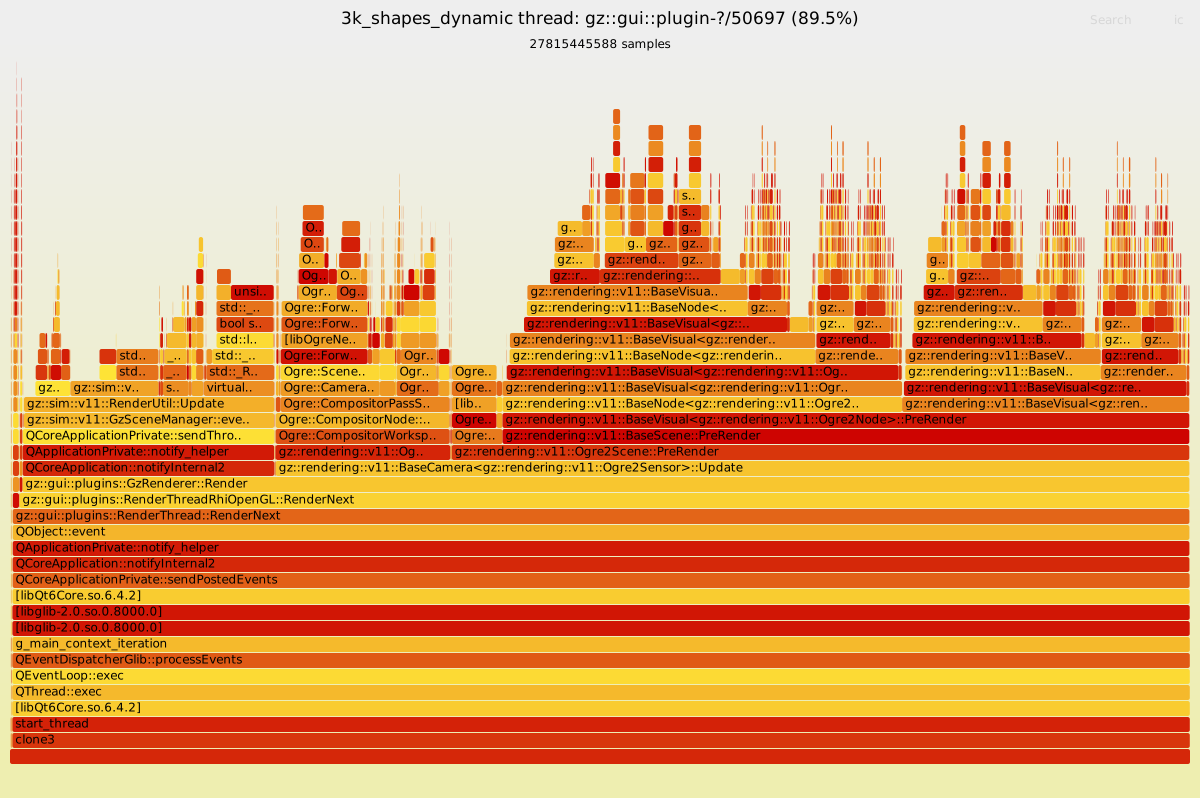
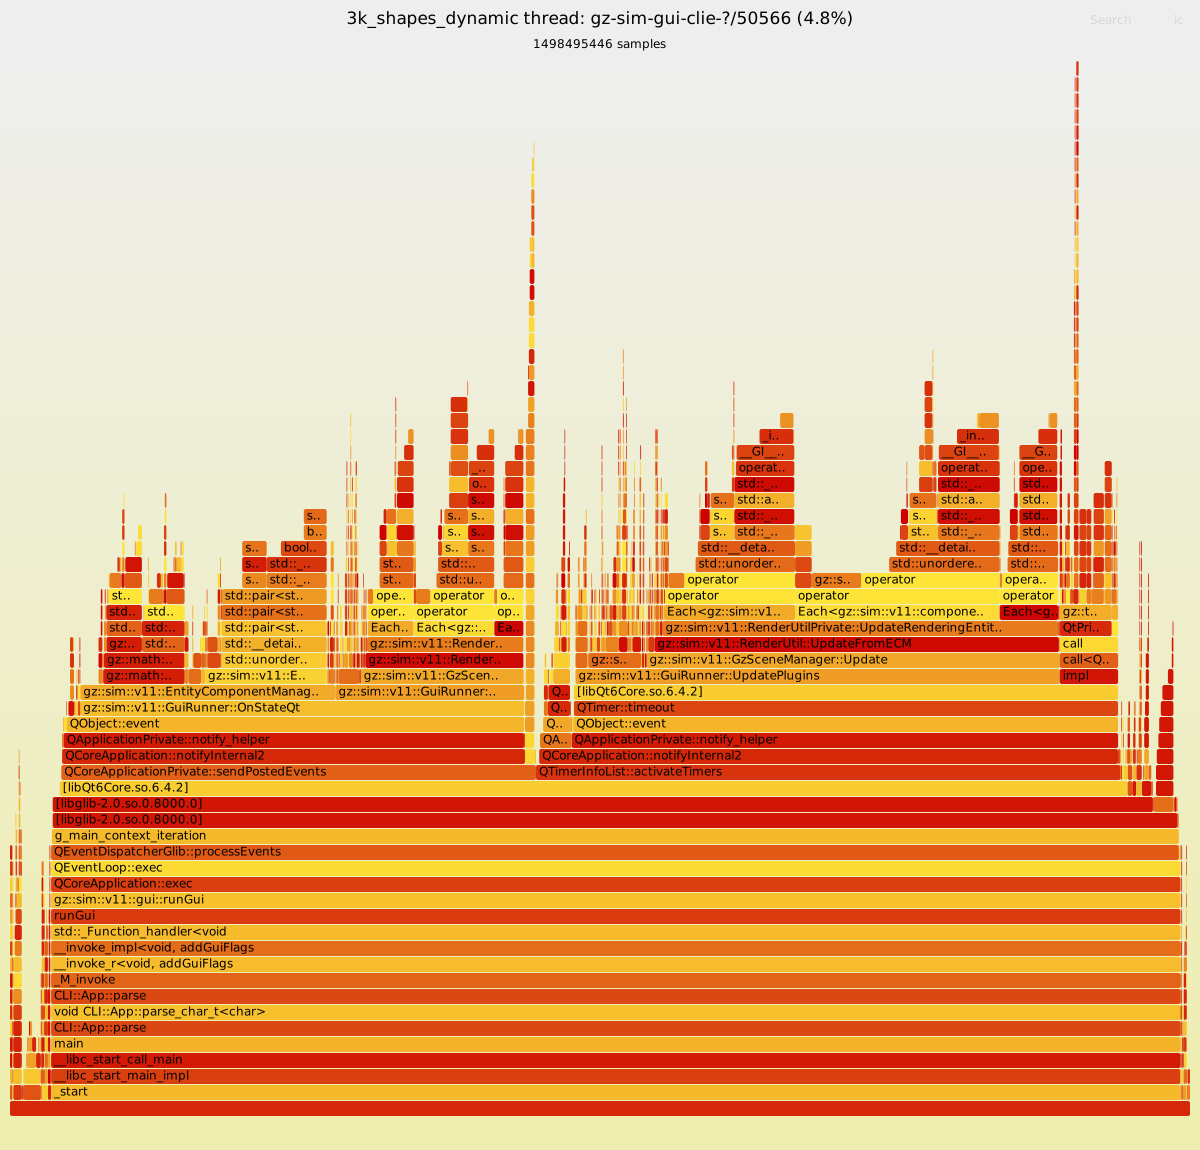
| 3k_shapes_dynamic | 1.04 | 90% | Open |
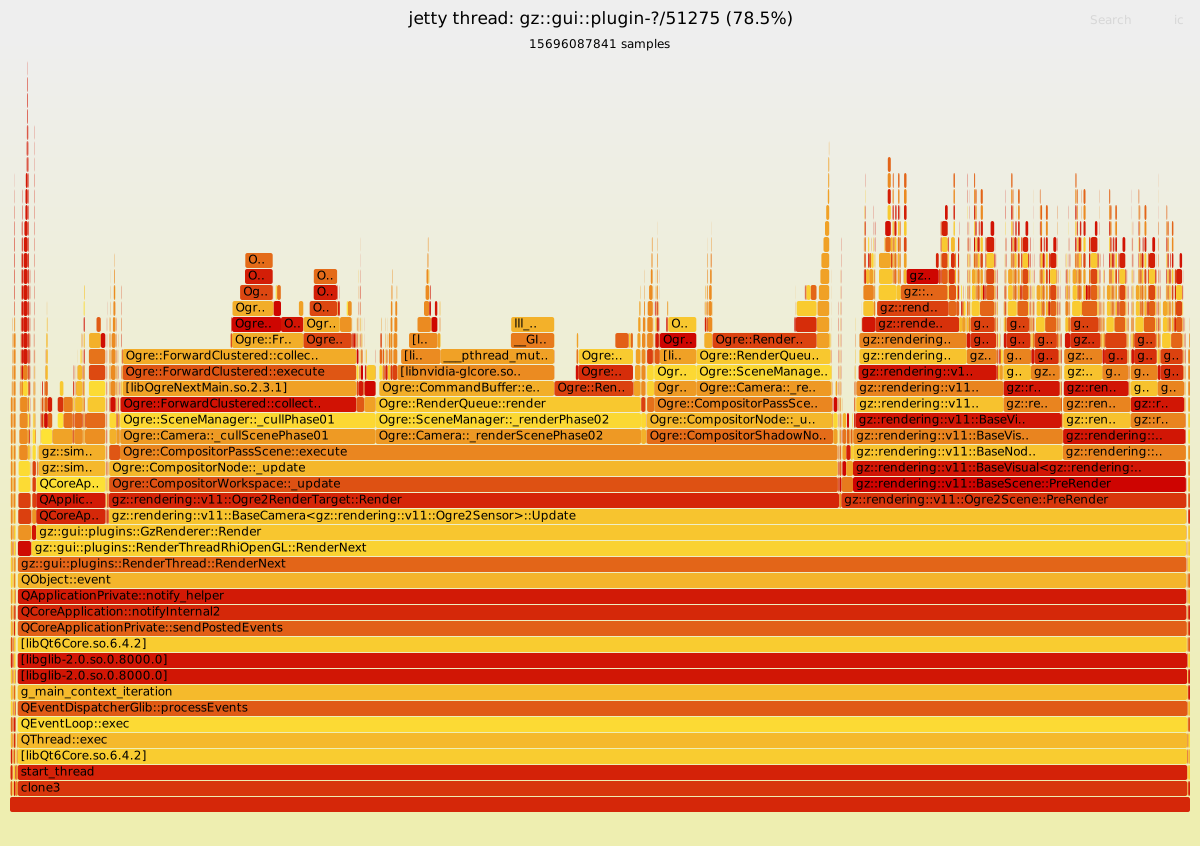
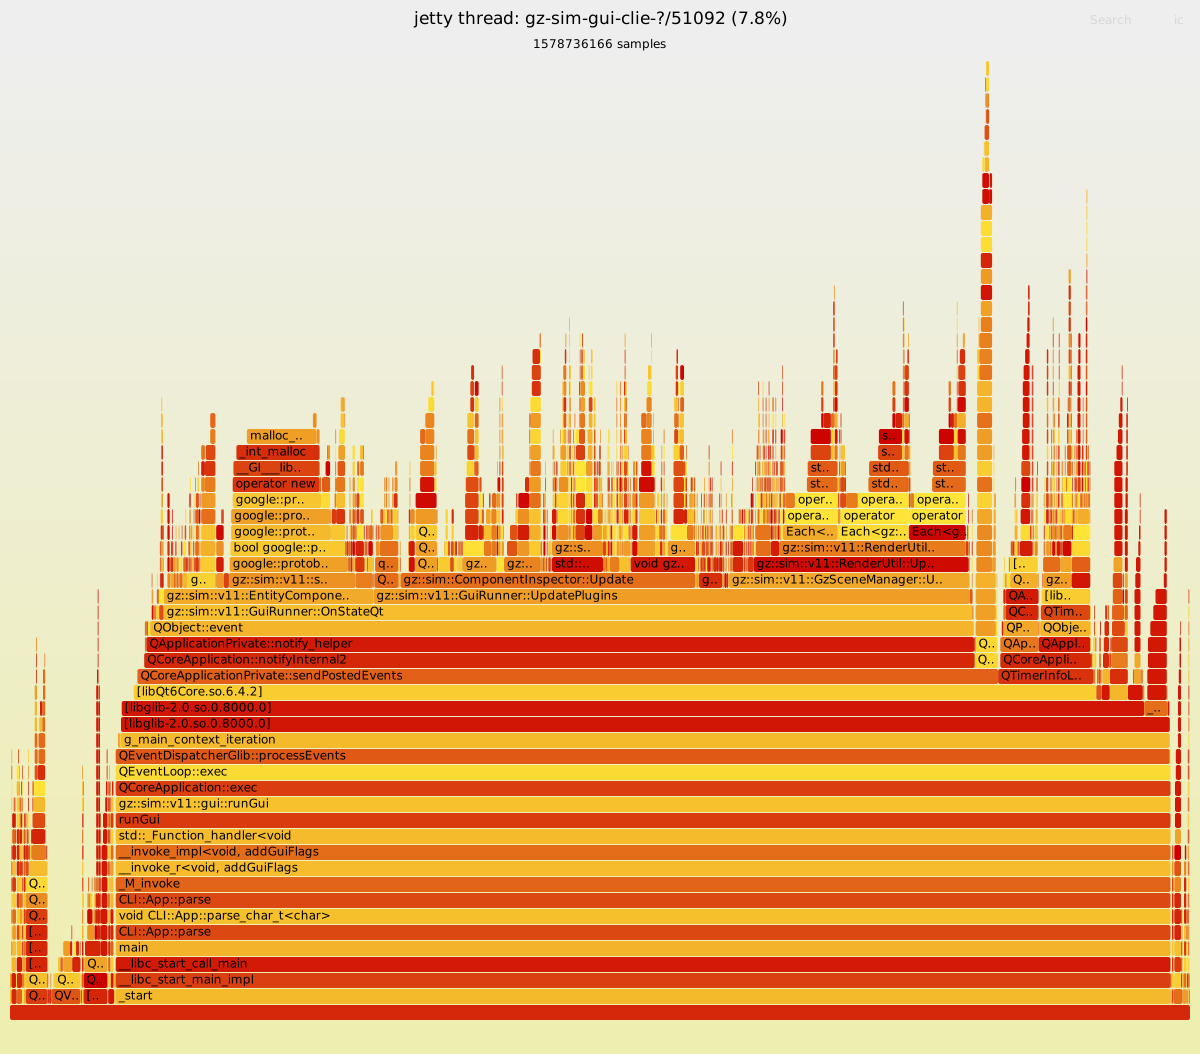
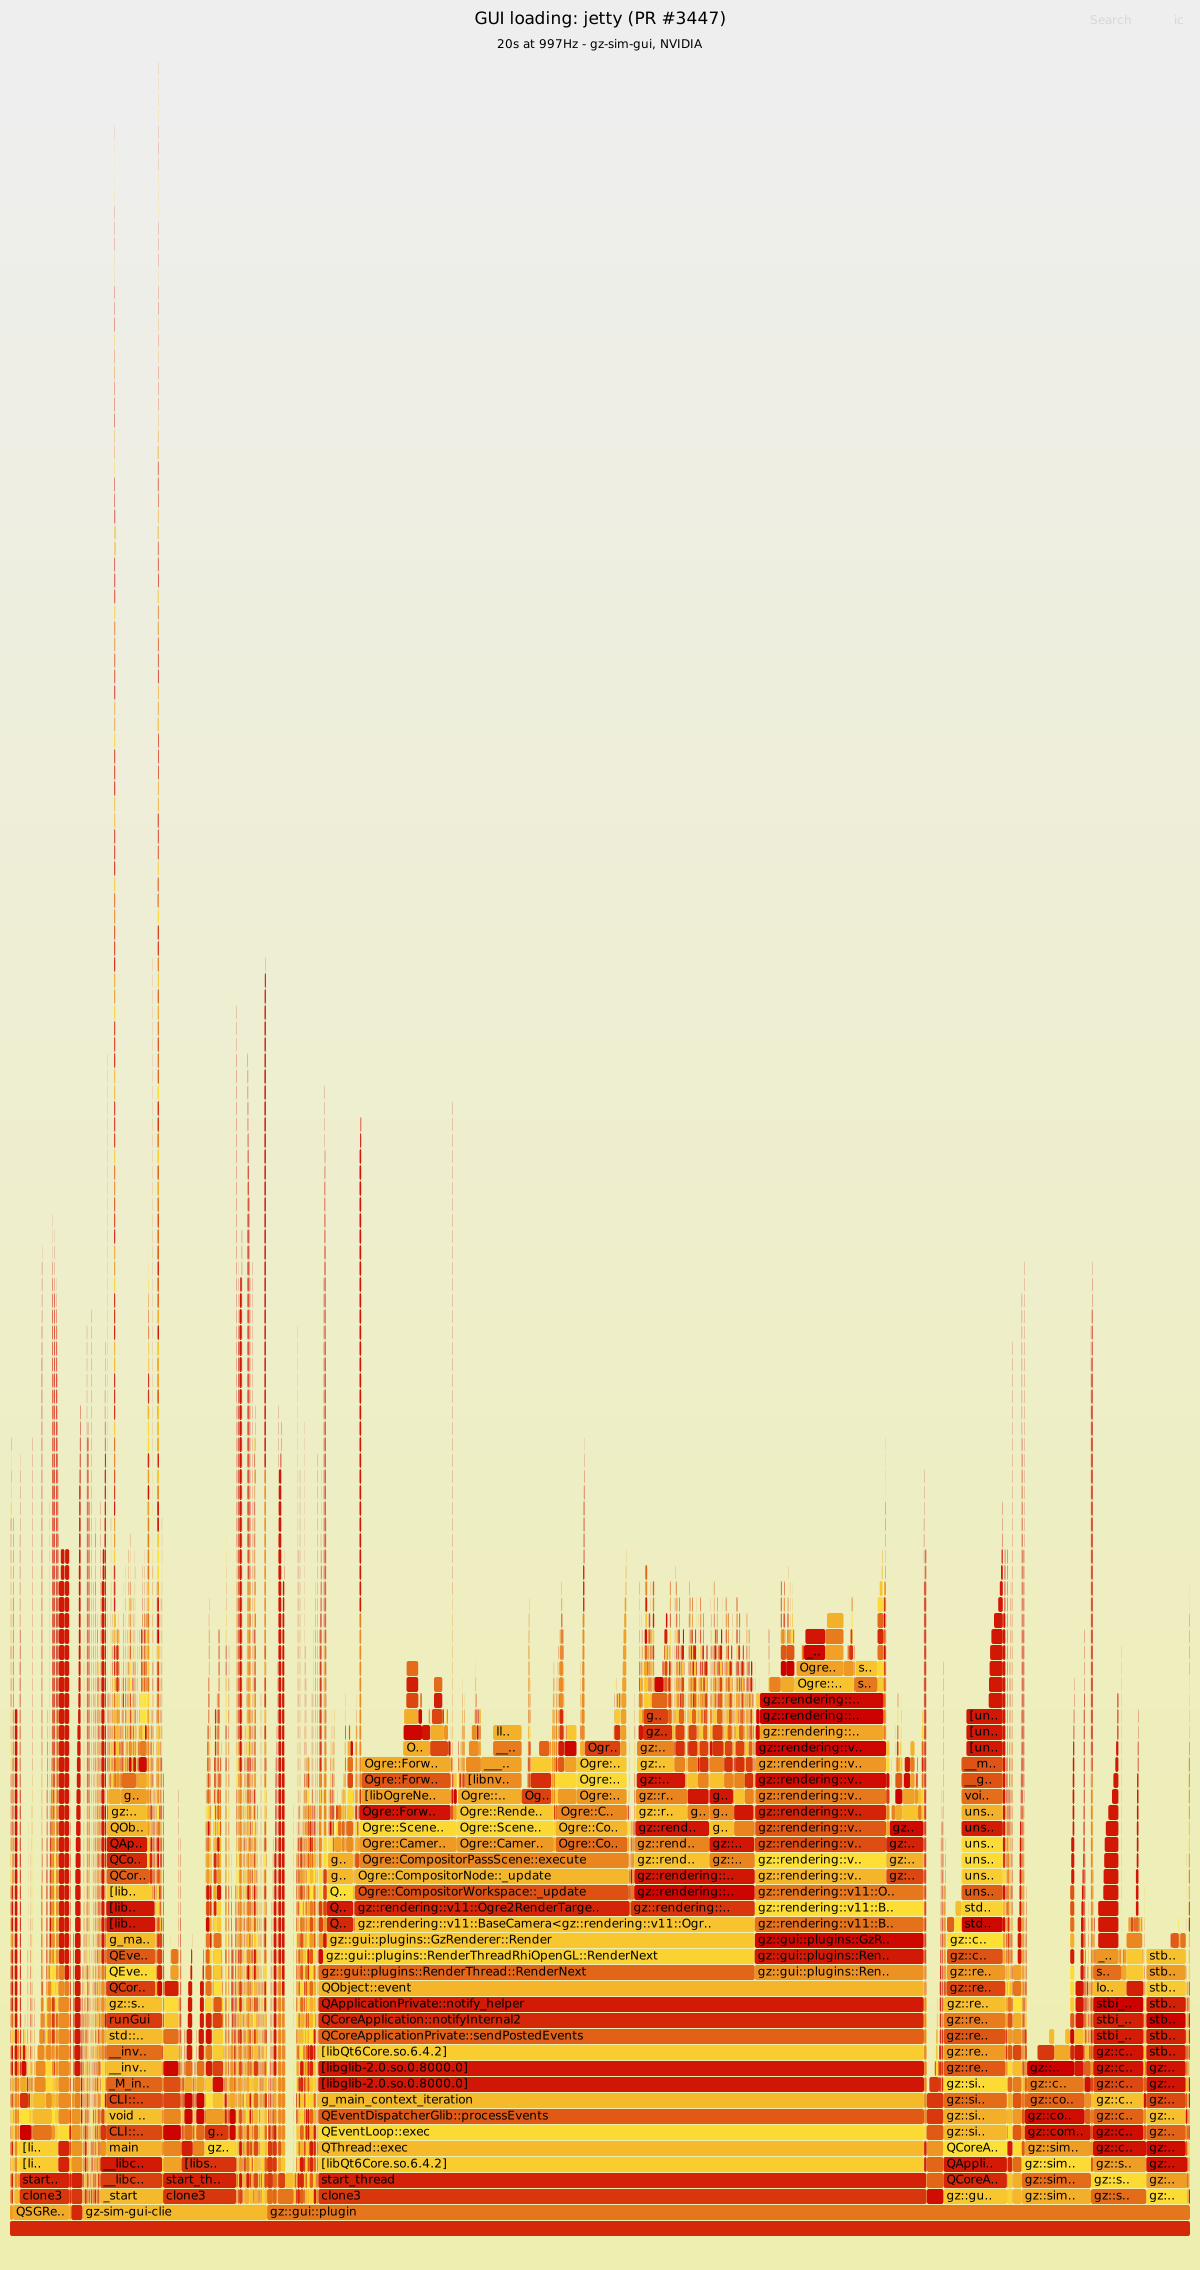
| jetty | 0.67 | 79% | Open |
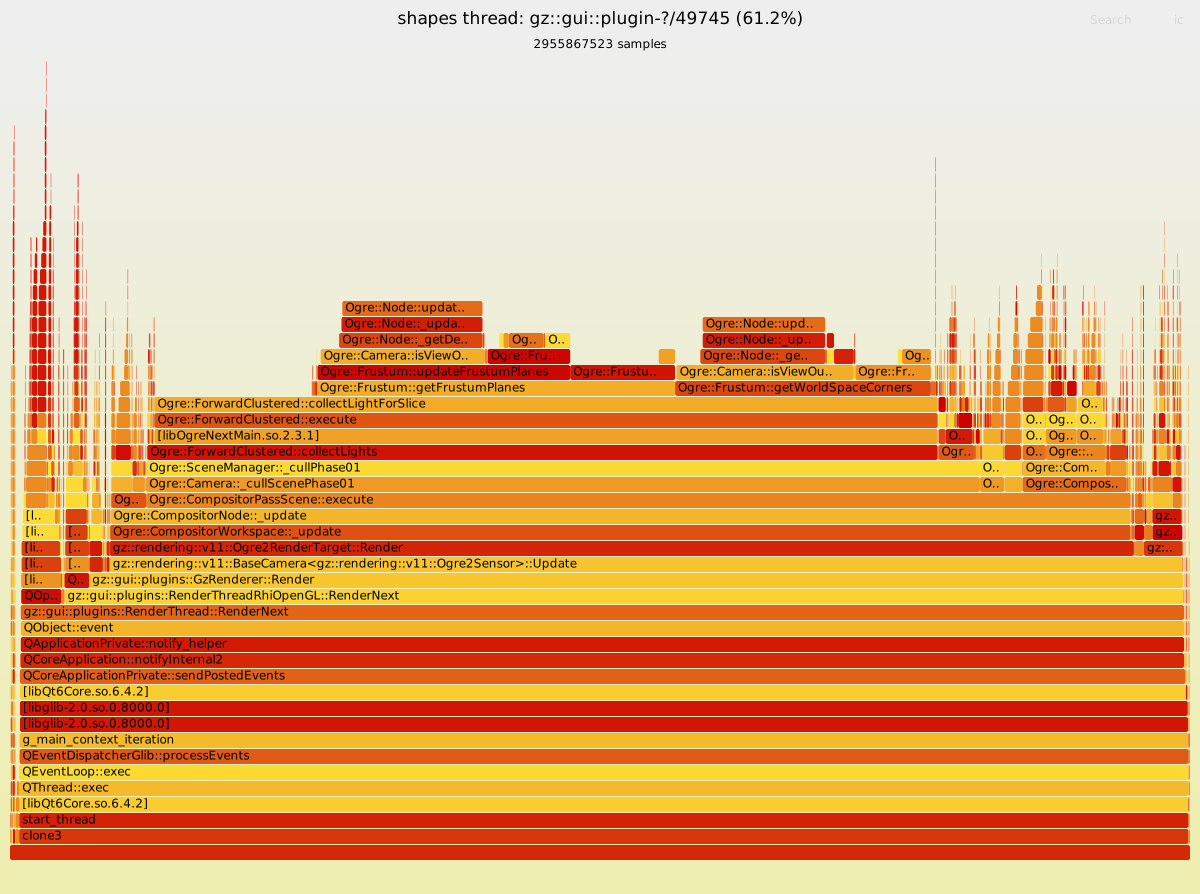
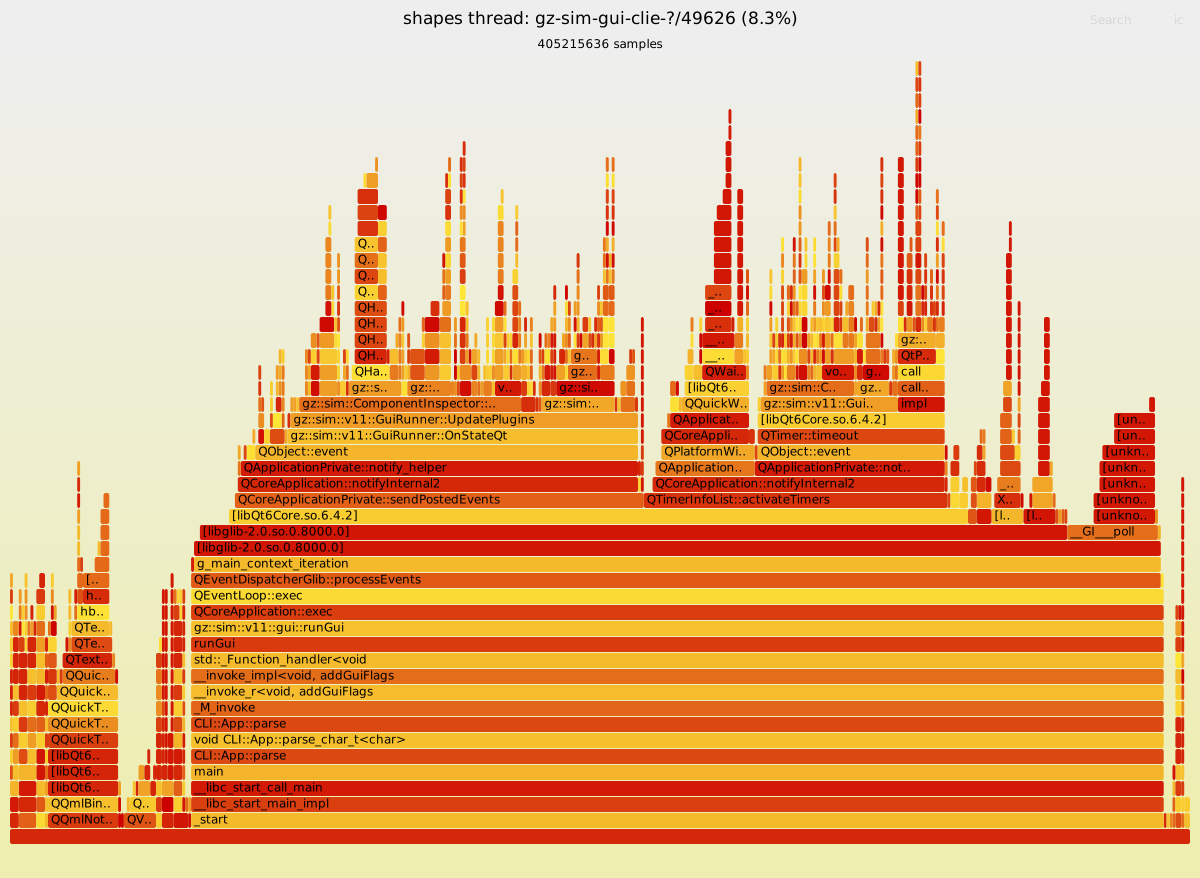
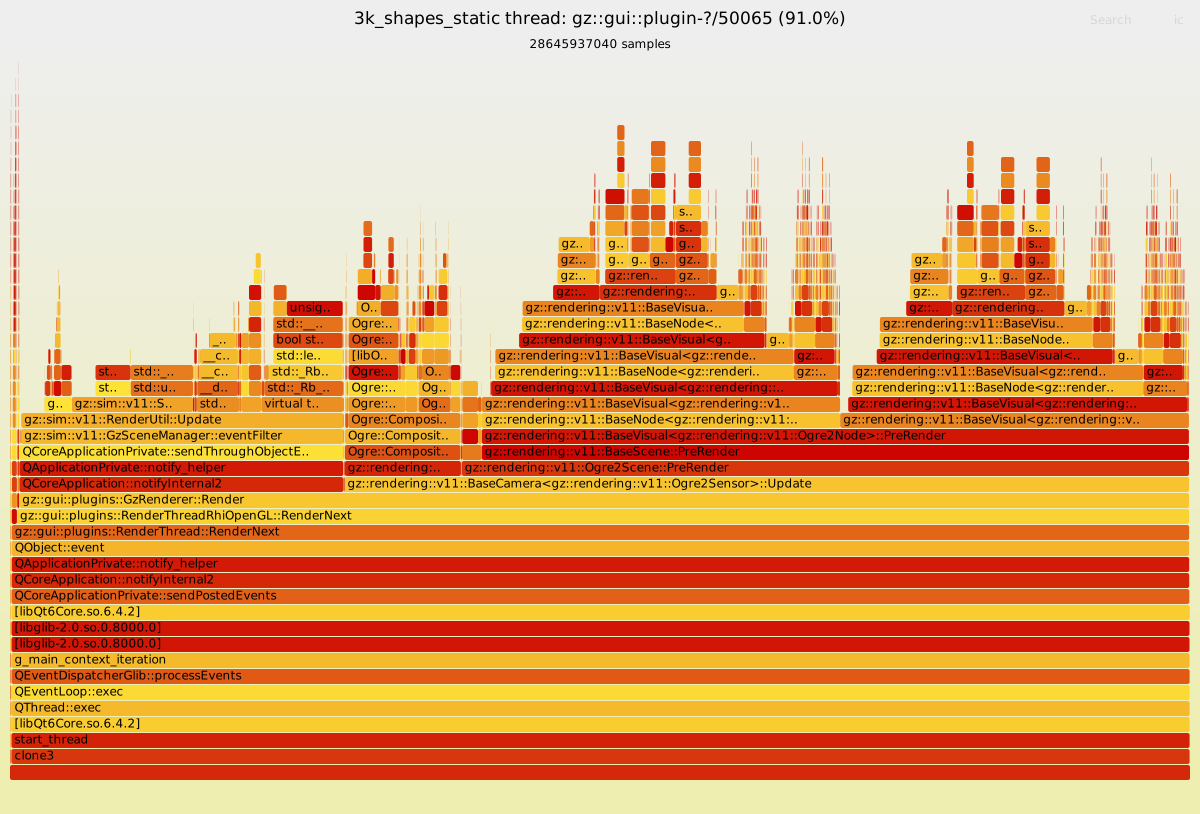
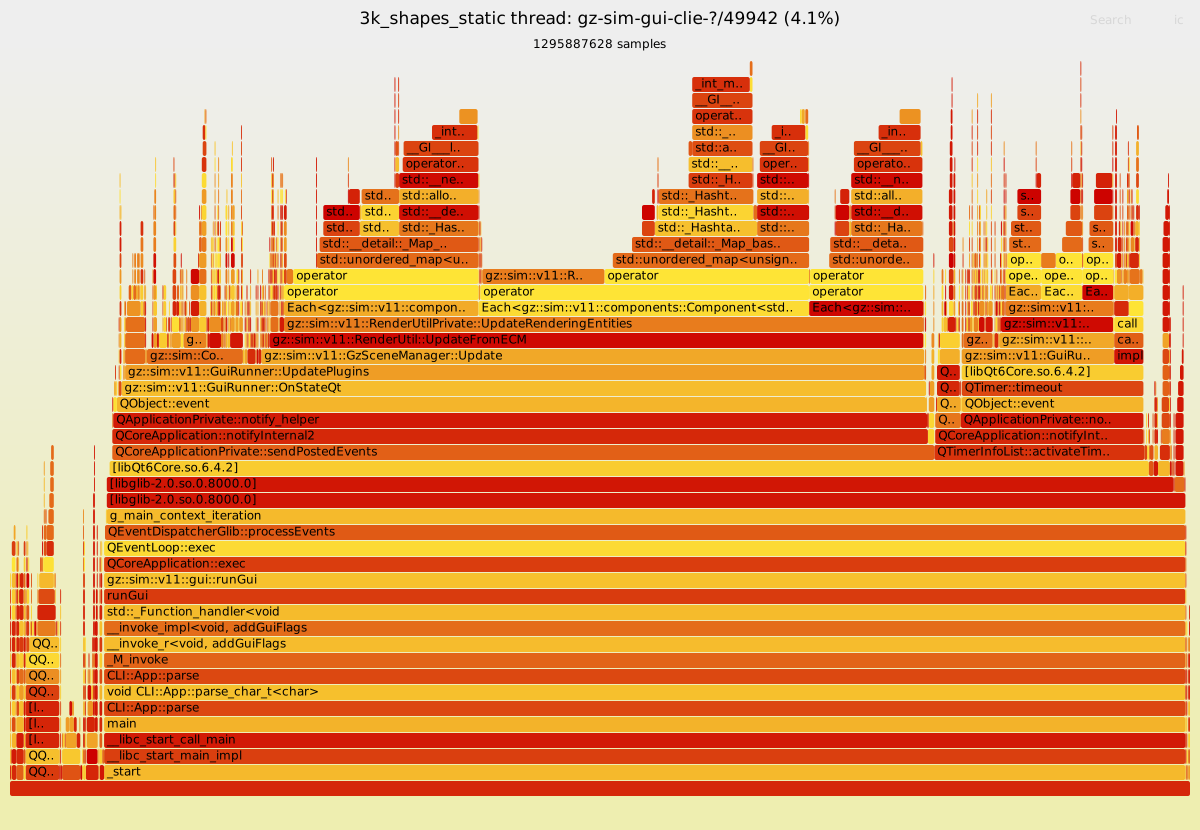
The GUI is render-thread-bound; per-thread splits separate the OgreNext render thread from the Qt main thread.
| World | Render thread | Qt main thread |
|---|---|---|
| shapes | Open | Open |
| 3k_shapes_static | Open | Open |
| 3k_shapes_dynamic | Open | Open |
| jetty | Open | Open |
| World | Dominant cost | Flamegraph |
|---|---|---|
| 3k_shapes_static | per-frame PreRender walk | Open |
| jetty | mesh + material construction | Open |
Generated with FlameGraph and Linux perf.